

The Food Cost Percentage Myth
Why food cost percentage alone is not enough to judge a restaurant, a menu, or a chef.
In many restaurants, food cost percentage is treated like the final truth.
At the end of the month, someone looks at the numbers, compares the actual food cost percentage with the budget, and decides whether the kitchen “performed well” or “failed”.
But this can be dangerous.
Food cost percentage is useful. It is important. It must be tracked. But it is not the whole story.
A restaurant does not pay its rent with percentages. It pays rent with money. It pays staff, suppliers, electricity, insurance, repairs, and taxes with real margin in the bank.
This is why food cost percentage must always be understood together with sales mix, gross margin, waste, portion control, pricing, and the real behaviour of customers.
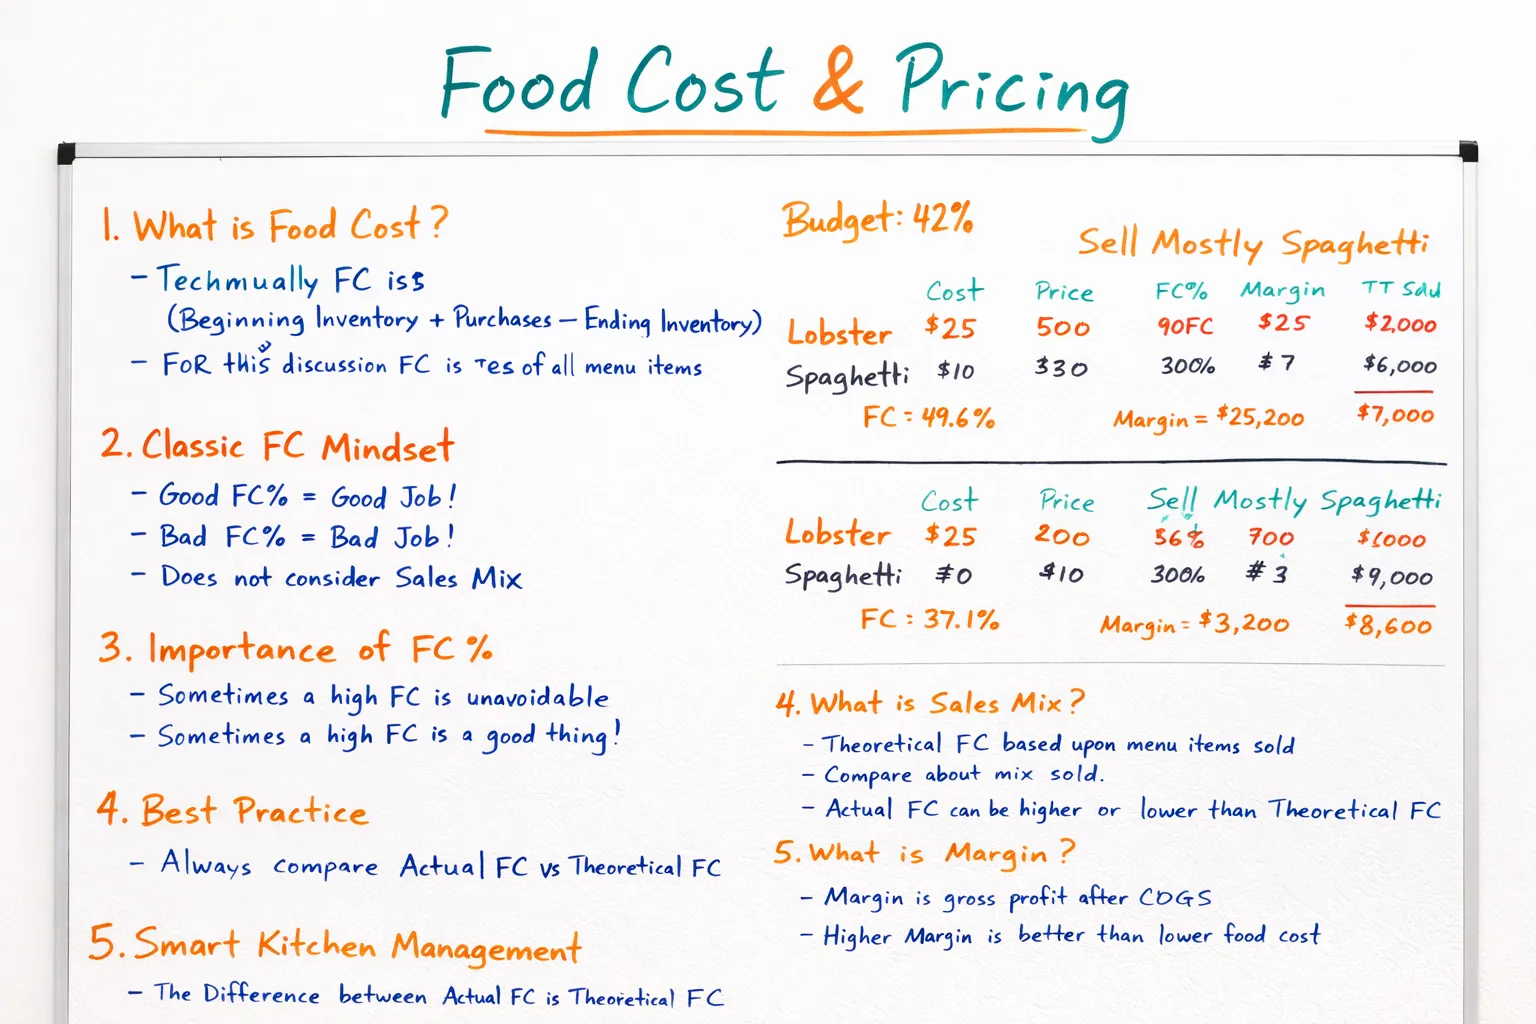
The classic food cost percentage formula is:
(Beginning inventory + purchases − ending inventory) ÷ food sales × 100
This gives the actual food cost percentage for a period.
For example, if the kitchen used €12,000 of food and generated €30,000 in food sales, the food cost percentage is 40%.
On paper, this looks simple.
But in real restaurant life, it becomes more complicated because not every dish has the same cost, price, margin, preparation time, waste risk, or sales volume.
It has a high ingredient cost, so the food cost percentage looks bad. But it also sells for a high price and brings a strong cash margin.
If one month the restaurant sells mostly lobster, the food cost percentage may look too high.
A high food cost percentage is not always bad.
The other is a simple pasta dish.
It has a low ingredient cost, so the food cost percentage looks beautiful. But the actual money earned per portion is much smaller.
If the next month the restaurant sells mostly pasta, the food cost percentage may look excellent.
A low food cost percentage is not always good.
But does that mean the pasta month was better? Not necessarily.
The lobster may create much more gross margin, even with a higher food cost percentage.
The real question is: How much money does each dish leave after ingredient cost?
Food Cost Percentage vs Gross Margin. Food cost percentage shows the relationship between ingredient cost and selling price.
DISH A
costs €25 to produce and sells for €50.
Food cost: 50%
Gross margin: €25
Dish A leaves €25 per sale.
DISH B
costs €3 to produce and sells for €10.
Food cost: 30%
Gross margin: €7
Dish B looks better as a percentage.
If the restaurant can sell Dish A consistently, execute it well, control waste, and maintain quality, it may be far more valuable to the business than the “better percentage” dish.
This is why chef management must look beyond one number. Sales mix means the combination of items actually sold during a period. Your theoretical food cost depends on what guests ordered.
| Scenario | Item | Cost | Price | FC% | Margin | Sold | TT Cost | TT Sales |
|---|---|---|---|---|---|---|---|---|
| Balanced Sales | Lobster | €25 | €50 | 50% | $25 | 100 | €2,500 | €5,000 |
| Spaghetti | €3 | $10 | 30% | $7 | 100 | €300 | €1,000 | |
| FC = 46.7% | Margin = €3,200 | €2,800 | €6,000 |
If guests order mostly high-cost premium dishes, the theoretical food cost will naturally rise.
If guests order mostly low-cost dishes, the theoretical food cost will naturally fall.
This does not automatically mean the kitchen did something wrong or right. It means the guests bought a different mix of products.
A serious food cost review must therefore compare:
* Actual food cost * Theoretical food cost * Sales mix * Gross margin * Waste * Stock movement * Portion control * Menu pricing
Without this, the discussion is incomplete!
Why Budget Food Cost Can Be Misleading
A fixed budgeted food cost percentage can be useful as a target, but it can also become unfair if it does not reflect the real menu. If management chooses a nice-looking number without understanding the menu, supplier prices, portion sizes, and customer behavior, the kitchen will always look like the problem. Sometimes the problem is bad pricing, bad purchasing, bad menu engineering, poor sales strategy, or an unrealistic budget.
Chef Control Point
Do not walk into a food cost meeting with only the actual food cost percentage.
Bring the full picture TO MANAGEMENT
You should know:
- What was sold
- Which dishes created the most revenue
- Which dishes created the best gross margin
- Which dishes had high waste
- Which dishes slowed down service
Which products increased in supplier price - Which items were over-portioned
- Which items were popular but weak in profit
- Which items looked expensive as a percentage but strong in cash margin
Be Ready For:
- Be ready for supplier price changes
- Be ready for sales mix questions
- Be ready for portion control checks
- Be ready for waste discussion
- Be ready for inventory questions
- Be ready for menu pricing review
- Be ready for staff meal and free item control
- Be ready for recipe and yield checks
- Be ready for specials and seasonal products – ask for them!
- Be calm, You know what to do!
The goal is not to blame the chef, the owner, the team, or the accountant. The goal is to understand where the money moved and what can be corrected next month.
Food cost is only one part of restaurant management.
Online-Chef creates practical kitchen management tools for chefs, restaurant owners, cafés, private chefs, and small hospitality businesses who need clearer systems, cleaner workflows, and better control behind the plate.